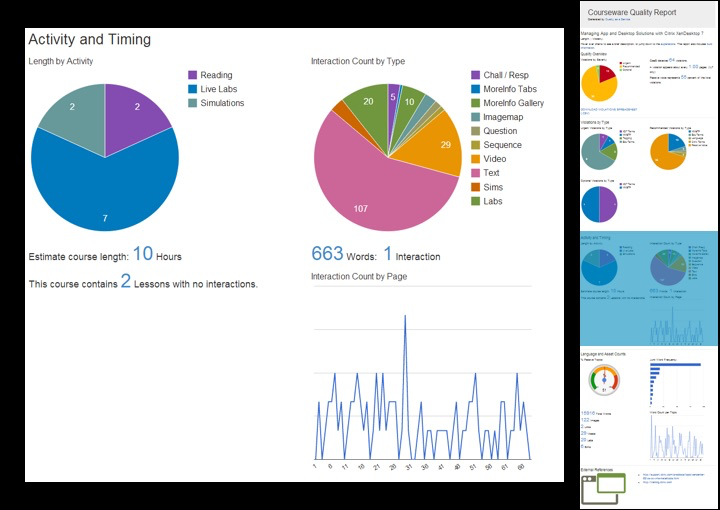
Of course, if the content uses a lot of “click to see more text” interactions, then a low ratio may be misleading. That’s why we also total up the number of each interaction type. Showing these two metrics together gives us a solid understanding of the variety and frequency of interaction in a course.
In addition, we are able to calculate reading time vs other activities, like videos, labs, and simulations, as well as an estimated total course length. Therefore, we have language metrics telling us about terminology and style use, interaction metrics telling us about variety and frequency, and timing metrics about various activity types. Those metrics combined give us a accurate picture of how engaging a course will be, without having to read a single page.
But, you know, you should still read the course. 🙂 But with the QA plugin, you know where to focus, what issues you are likely to encounter, and how much work you are likely to need in order to get the course ready for release.
If you have a use case for the QA plugin, please let us know! We’d be more than happy to feature it here on ditanauts.

